
Number of port calls decreases while cargo volumes increase
News 2026-07-23
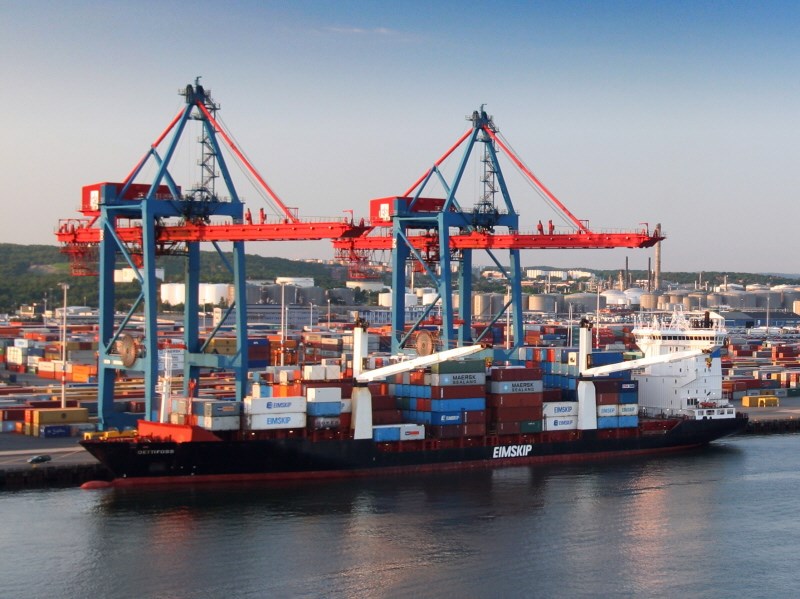
When the Swedish Maritime Administration presents its statistics on port calls for the second quarter of 2026, the trend continues: fewer vessels are calling at Swedish ports, while cargo volumes are increasing.
The world's merchant fleet has been growing steadily larger for many years, enabling vessels to carry more cargo. This is reflected in the statistics: during the second quarter of 2026, the number of port calls decreased by approximately 1.5 per cent, while cargo volumes increased by around 2.6 per cent.
– The global merchant fleet continues to grow, and vessels are becoming increasingly larger. This means that each port call can carry more cargo, which is a key reason why cargo volumes continue to increase despite the decline in the number of port calls. Maritime transport is vital to Sweden, as nine out of every ten goods imported to or exported from the country are transported by sea, says Niclas Härenstam, Director of Communications at the Swedish Maritime Administration.
Cargo volumes and passenger numbers at Sweden's ports fluctuate over time, but two ports stand out when it comes to freight transport. Both the Port of Gothenburg and the Port of Helsingborg recorded an increase of around 10 per cent in cargo volumes during the latest quarter compared with the corresponding period last year.
At the same time, the number of passengers decreased by approximately 0.9 per cent compared with the same quarter last year. Stockholm and Helsingborg remain Sweden's busiest passenger ports.
Ports with the highest number of port calls, top 20
| # | Port city | Declared port calls – 2026 | Declared port calls – 2025 | Change compared with Q1 2025 (%) |
|
1 |
SEHEL - Helsingborg | 11 941 | 11 859 | 0,69 % |
| 2 | SEGOT - Göteborg | 2 663 | 2 642 | 0,79 % |
| 3 | SETRG - Trelleborg | 2 112 | 2 128 | - 0,75 % |
| 4 | SEYST - Ystad | 1 578 | 1 618 | - 2,47 % |
| 5 | SESTO - Stockholm | 1 354 | 1 303 | 3,91 % |
| 6 | SEMMA - Malmö | 953 | 977 | - 2,46 % |
| 7 | SEVBY - Visby | 693 | 717 | - 3,35 % |
| 8 | SENYN - Nynäshamn | 645 | 651 | - 0,92 % |
| 9 | SEKAN - Karlshamn | 569 | 686 | - 17,06 % |
| 10 | SEKPS - Kapellskär | 562 | 627 | - 10,37 % |
| 11 | SEGRH - Grisslehamn | 531 | 537 | - 1,12 % |
| 12 | SEBRO - Brofjorden | 485 | 427 | 13,58 % |
| 13 | SEKAA - Karlskrona | 467 | 534 | - 12,55 % |
| 14 | SEHAD - Halmstad | 460 | 556 | - 17,27 % |
| 15 | SEHLD - Holmsund | 410 | 414 | - 0,97 % |
| 16 | SENRK - Norrköping | 377 | 360 | 4,72 % |
| 17 | SESMD - Strömstad | 323 | 345 | - 6,38 % |
| 18 | SEOSK - Oskarshamn | 296 | 298 | - 0,67 % |
| 19 | SEOXE - Oxelösund | 270 | 261 | 3,45 % |
| 20 | SESLI - Slite | 269 | 278 | - 3,24 % |
Ports with the largest cargo volumes, top 20
Cargo weight refers to goods loaded and unloaded, both domestic and international, by port city (excluding private cars).
| # | Port city | Net cargo weight – 2026 | Net cargo weight – 2025 | Change compared with Q1 2025 (%) |
| 1 | SEGOT - Göteborg | 19 825 131 | 17 965 691 | 10,35 % |
| 2 | SEBRO - Brofjorden | 9 801 560 | 9 215 649 | 6,36 % |
| 3 | SETRG - Trelleborg | 6 297 659 | 6 148 586 | 2,42 % |
| 4 | SEHEL - Helsingborg | 4 562 790 | 4 140 988 | 10,19 % |
| 5 | SELLA - Luleå | 3 275 026 | 3 406 214 | - 3,85 % |
| 6 | SEMMA - Malmö | 3 274 345 | 3 444 272 | - 4,93 % |
| 7 | SEOXE - Oxelösund | 2 565 828 | 2 595 162 | - 1,13 % |
| 8 | SEKAN - Karlshamn | 2 225 434 | 2 284 504 | - 2,59 % |
| 9 | SEGVX - Gävle | 2 098 113 | 1 833 609 | 14,43 % |
| 10 | SENRK - Norrköping | 1 704 797 | 1 660 065 | 2,69 % |
| 11 | SESTE - Stenungsund | 1 702 929 | 1 877 748 | - 9,31 % |
| 12 | SESTO - Stockholm | 1 491 519 | 1 450 144 | 2,85 % |
| 13 | SEKPS - Kapellskär | 1 468 444 | 1 412 580 | 3,95 % |
| 14 | SESLI - Slite | 1 454 269 | 1 437 972 | 1,13 % |
| 15 | SEYST - Ystad | 1 421 864 | 1 363 822 | 4,26 % |
| 16 | SENYN - Nynäshamn | 1 251 983 | 1 217 727 | 2,81 % |
| 17 | SEKAA - Karlskrona | 1 115 987 | 1 305 644 | - 14,53 % |
| 18 | SEHAD - Halmstad | 1 111 747 | 1 216 563 | - 8,62 % |
| 19 | SEHLD - Holmsund | 1 079 086 | 1 020 157 | 5,78 % |
| 20 | SEVST - Västerås | 858 583 | 901 588 | - 4,77 % |
Ports with the highest number of passengers, top 20
The report covers arriving and departing passengers, both domestic and international, by port city.
| # | Port city | Pax - 20262 | Pax - 20252 | Change compared with Q1 2025 (%) |
| 1 | SEHEL - Helsingborg | 2 244 800 |
2 2222 333 |
1,01 % |
| 2 | SESTO - Stockholm | 2 2242 011 |
2 2218 239 |
1,07 % |
| 3 | SEYST - Ystad | 922 812 | 951 324 | - 3,00 % |
| 4 | SEVBY - Visby | 795 666 | 831 358 | - 4,29 % |
| 5 | SENYN - Nynäshamn | 567 909 | 592 743 | - 4,19 % |
| 6 | SEGOT - Göteborg | 538 597 | 523 253 | 2,93 % |
| 7 | SEGRH - Grisslehamn | 442 478 | 459 545 | - 3,71 % |
| 8 | SESMD - Strömstad | 403 108 | 441 685 | - 8,73 % |
| 9 | SETRG - Trelleborg | 343 614 | 337 001 | 1,96 % |
| 10 | SEKAA - Karlskrona | 209 411 | 193 932 | 7,98 % |
| 11 | SEOSK - Oskarshamn | 145 268 | 153 984 | - 5,66 % |
| 12 | SEKPS - Kapellskär | 109 546 | 107 497 | 1,91 % |
| 13 | SEHLD - Holmsund | 93 428 | 96 615 | - 3,30 % |
| 14 | SENRR - Norvik | 87 266 | 88 731 | - 1,65 % |
| 15 | SEMMA - Malmö | 62 295 | 63 538 | - 1,96 % |
| 16 | SEKAN - Karlshamn | 54 974 | 63 891 | - 13,96 % |
| 17 | SEHND - Härnösand | 8 415 | 7 192 | 17,01 % |
| 18 | SEHAD - Halmstad | 6 323 | 21 010 | - 69,90 % |
| 19 | SELLA - Luleå | 2 251 | 2 326 | - 3,22 % |